


TECHNICAL INDICATORS: GUIDES TO SUCCESSFUL DAY TRADING?
Some traders focus heavily on technical indicators like the RSI (Relative Strength Index), the moving average convergence divergence (also known as the MACD), or the moving average crossover. There are hundreds, if not thousands, of sophisticated technical indicators out there. Some traders believe they have found the Holy Grail of technical indicators, and it might be a combination of RSI or the moving average crossover.
I don’t believe having a large number of technical indicators will automatically make you a successful day trader. Day trading is not mechanical and automated. It is discretionary. Traders need to make real time decisions. The success of each strategy is based on judgment and the proper execution of it by the trader.
Of course, I use the RSI in my scanner for some of my trading strategies, and in particular for reversal trading. I have scanners that rely on a high or low RSI, but those are more conditioned to find stocks at extremes. They are by no means a buy-or-sell indicator.
I am skeptical of the strategies that have many indicators. I don’t think that having more indicators on your chart helps you in day trading, especially since you need to be able to process information very quickly, at times in just a matter of seconds. I have found that often indicators’ signals will also contradict each other and that will lead to confusion.
That is why my day trading indicators are limited to VWAP and a few other moving averages. For my swing trading, I use more complicated indicators such as MACD because I do not have to make quick decisions. I usually review my swing trading after the market closes, with proper due diligence and evaluation. You can easily find more information about the indicators I’ve mentioned, along with many others, by doing a simple online search.
Some of my day trader colleagues may disagree with me, but my personal experience is that you cannot enter a trade with a mechanical and systematic approach and then let the indicators dictate your entry and exit. That in fact is one of my rules for day trading: Indicators only indicate; they should not be allowed to dictate.
Computers are trading all of the time. When you set up a system for trading that has no input or requires no decisions by the trader, then you are entering the world of algorithmic trading, and you will lose trades to investment banks that have million-dollar algorithms and billions of dollars in cash for trading.
Indicators on my Charts
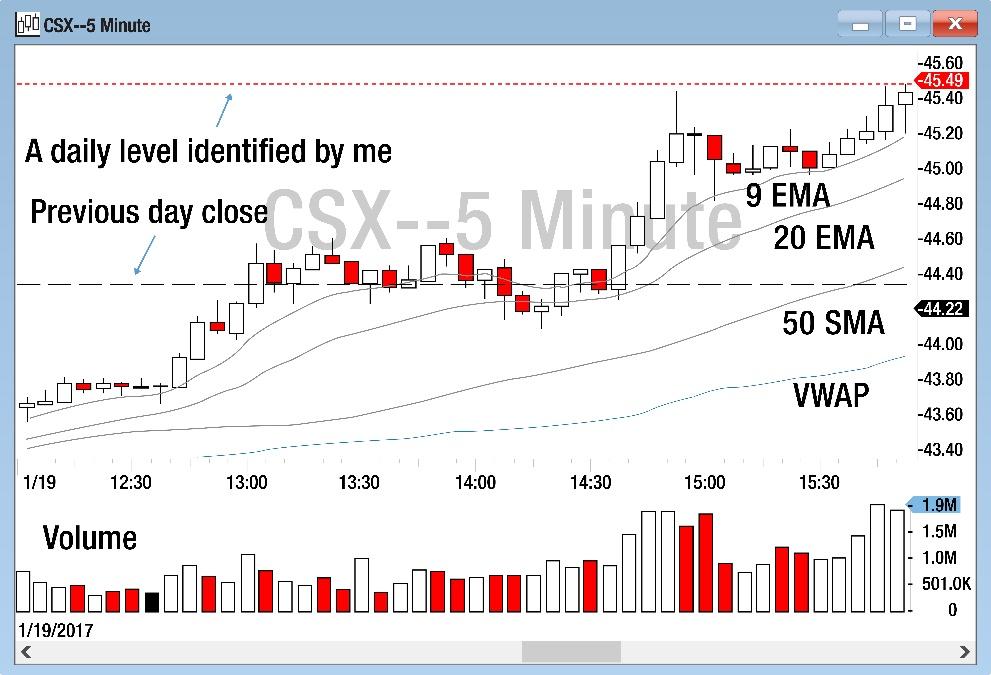
Screenshot of the type of chart I use with my indicators marked on it. Only 200 SMA is not shown because it was moving outside of the zoomed price range.
I keep my charts relatively clean with a minimal number of indicators displayed. In day trading, you need to process information quickly and you need to make decisions very, very quickly. Therefore, I cannot keep track of too many indicators. Here is what I have on my charts:
- Price action in the form of candlesticks
- Volume of shares being traded
- 9 Exponential Moving Average (9 EMA)
- 20 Exponential Moving Average (20 EMA)
- 50 Simple Moving Average (50 SMA)
- 200 Simple Moving Average (200 SMA)
- Volume Weighted Average Price (VWAP)
- Previous day’s closing price
All of the above indicators are automatically being calculated and plotted by my DAS Trader Pro platform. I do not find, calculate or plot these manually.
9. Daily levels of support or resistance
For daily levels of support or resistance, my platform does not automatically find and plot them. These levels have to be identified manually by traders. I usually find and plot these levels during my pre-market screening for Stocks in Play on my watchlist or during the day when a new stock hits my scanners. I don’t trade without knowing nearby significant intraday levels of support or resistance.
I keep the color of all of my moving average indicators in gray except VWAP, which is colored in blue. VWAP is the most important day trading indicator and needs to be easily and quickly distinguished from other moving averages. I don’t want to have a lot of colors on my charts, and so I maintain a white background with mostly red and black coloring. Heavily colored charts are confusing and over the long term irritate your eyes and limit your vision. I avoid dark background colors on my charts because processing dark colors for any length of time makes my eyes feel achy and weak.
Nasdaq Level 2 and Bid-Ask
From my perspective, having access to Nasdaq Level 2 is virtually mandatory in order to day trade in the U.S. markets. Level 2 provides important insight into a stock’s price action, including what type of traders are buying or selling a stock and where the stock is likely to head in the near term. Level 2 is known to be a “leading indicator”, which means it shows activity before a trade happens. Moving averages, charts and most of the other indicators are known as “lagging indicators,” meaning they provide information after the trades take place.
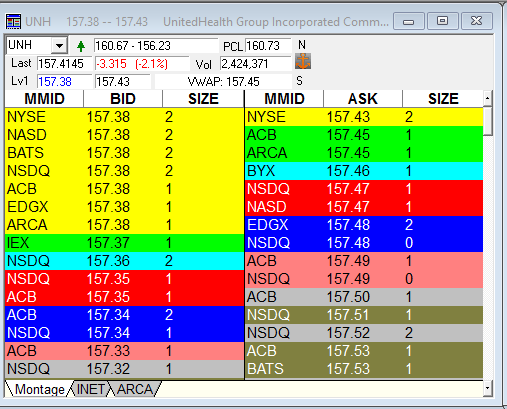
Example of a Nasdaq Level 2 for UnitedHealth Group Inc. (ticker: UNH) in the middle of the trading day. Note that the number of shares (the “SIZE”) is in hundreds (×100).
Level 2 is essentially the order book for Nasdaq stocks. When orders are placed, they are placed through many different market makers and other market participants. Level 2 will show you a ranked list of the best bid and ask prices from each of these participants, giving you detailed insight into the price action. Knowing exactly who has an interest in a stock can be extremely useful, especially if you are day trading.
Resources:
- In this video, Aiman talks about how he uses three indicators for day trading: VWAP, ATR and Volume.
- Develop your skills with this free real time day trading simulator.
- Check out the most advanced tools for traders and investors: https://tradingterminal.com/
- Learn about one of the best technologies for active trading.
- A Glossary of Terms Frequently Used in Day Trading
Would you like to ask Andrew Aziz some questions or share your own experiences? He would enjoy hearing from you at [email protected].